
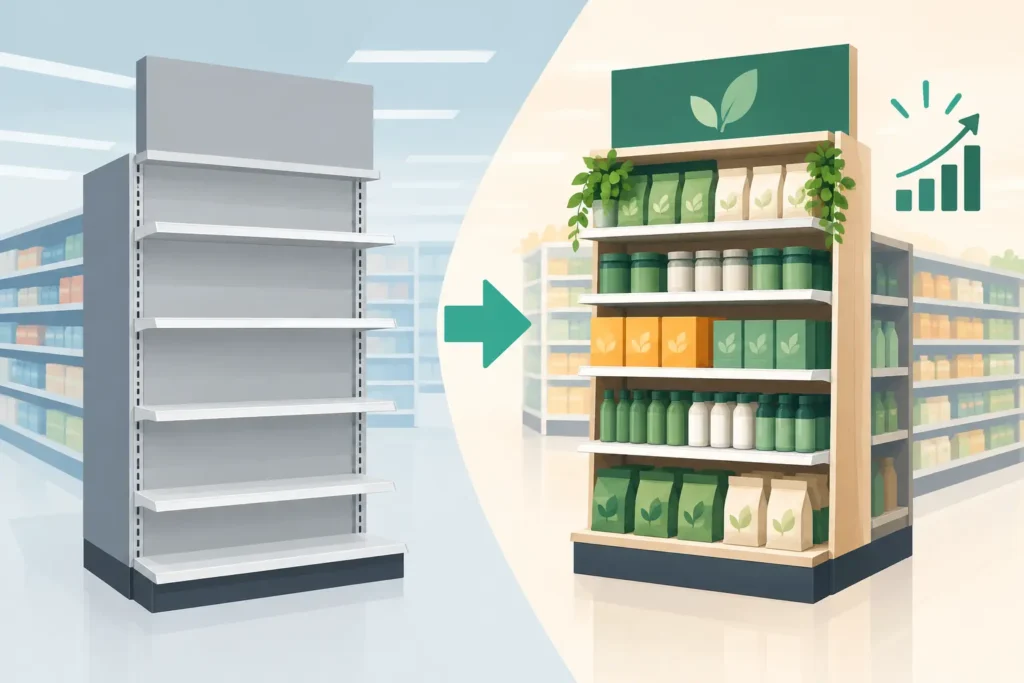
A strong endcap conversion example starts with a familiar retail problem: a high-traffic aisle end looks busy, but it is not producing enough incremental sales to justify the inventory, labor, and promotional space assigned to it. The answer is rarely just adding a larger sign. High-performing endcaps align the product, shopper mission, fixture, price message, and replenishment plan.
For supermarket operators, specialty retailers, and fit-out teams, an endcap is valuable because it sits at a decision point. Shoppers see it before entering an aisle, when turning a corner, or while moving toward checkout. That visibility can create a meaningful sales lift, but only when the display is built for the way customers actually shop.
An Endcap Conversion Example in a Grocery Store
Consider a neighborhood grocery store promoting a weekend grilling occasion. The store selects a 4-foot gondola endcap at the entrance to the condiment and packaged-food aisle. Previously, that endcap held a mixed assortment of slow-moving sauces and snack items. It looked full, but the message was unclear and store staff had to refill it inconsistently.
The revised display focuses on one clear purchase occasion: “Build Your Burger Night.” It contains ketchup, mustard, barbecue sauce, burger seasoning, pickles, and a small number of premium sauces. The products are not random bestsellers. They are complementary items that make sense together and encourage basket building.
A simple header sign communicates the occasion from several feet away. Shelf-edge price strips identify each item, while a small promotional card highlights a multi-buy offer on the core products. The endcap uses adjustable shelving to keep facings neat and prevent smaller bottles from disappearing behind larger packs. The store maintains enough stock depth for a three-day promotional period, with reserve inventory close by.
Before the change, the old endcap generated an average of $420 in weekly sales. During the four-week test, the revised endcap generated $1,080 per week. The store cannot call the full $660 increase pure endcap profit, because some customers may have bought the same products elsewhere in the store. Instead, the team compares total category sales, promoted-item sales, gross margin, and units per transaction against a similar period and a comparable store where possible.
The results show that condiment-category sales increased by 22%, while the promoted items sold at a faster rate than on the regular shelf. Average basket value also rose on weekends. The display converted more passing shoppers because it gave them a relevant idea, made the products easy to identify, and removed the need to search several aisles for the components of a meal.
That is the practical point of an endcap: it should make a purchase easier or more compelling than it would be on the standard shelf.
How to Calculate Endcap Conversion
Retailers use the term conversion differently, so establish the definition before evaluating performance. For a physical endcap, conversion can mean the percentage of shoppers who pass the display and purchase a promoted item. It can also refer to the percentage of shoppers who stop, engage, and add an item to their basket.
If a store uses traffic-counting technology or observation sampling, the calculation is straightforward:
Endcap conversion rate = shoppers who buy a promoted item ÷ shoppers exposed to the endcap × 100
For example, if 2,000 shoppers pass an endcap during a promotion and 180 purchase a featured item, the endcap conversion rate is 9%. That figure becomes more useful when compared with a previous display, a similar aisle-end location, or a control store.
Not every retailer has precise traffic data. In that case, use a practical performance scorecard: weekly sales, unit velocity, gross margin, sell-through rate, inventory turns, and category lift. Point-of-sale data is usually sufficient to identify whether an endcap is improving sales performance or simply moving existing demand from one shelf to another.
The best measurement period depends on the category. A snack promotion may show results in days. Small appliances, electronics accessories, or fashion-led displays may need several weeks. Avoid judging a display after one unusually busy weekend or a period affected by stockouts.
What Made This Display Convert
The grocery example worked because several execution details supported the same shopper decision. The assortment had a single purpose. The display did not ask shoppers to interpret a broad collection of unrelated products.
Product selection also mattered. A strong endcap typically includes a lead product that attracts attention, supported by practical add-ons. A retailer may lead with a promotional barbecue sauce, then add seasoning, pickles, and sauces that raise basket value. An electronics retailer could lead with a phone accessory bundle, then add chargers, screen protection, and cables.
Signage must be visible without competing with the merchandise. A large, direct headline works better than a sign packed with brand copy. Pricing should be easy to scan from the shopper’s approach path. If an offer has conditions, state them clearly. Confusing promotional mechanics can reduce trust and create friction at checkout.
Fixture selection is equally commercial. Gondola end bays suit high-volume packaged goods because they provide capacity, flexible shelf positions, and a familiar shopping format. Acrylic trays and dividers help organize small items. Pegboard panels and hooks are more effective for hanging accessories, while lockable display solutions may be necessary for high-value electronics. The correct fixture protects presentation standards throughout the promotion, not only at setup.
Build the Endcap Around the Location
An endcap near the store entrance needs a fast, high-impact message because shoppers are still orienting themselves. It is well suited to seasonal promotions, new arrivals, and broad-appeal offers. An endcap at the back of the store can support destination categories and encourage customers to complete a planned purchase.
Cross-merchandising should reflect the store layout. A grilling display placed at the condiment aisle may work well because shoppers are already thinking about meal components. The same products beside household cleaning items may gain traffic but lose relevance. High traffic is not enough if the offer does not match the shopper’s mission at that point in the journey.
There is also a capacity trade-off. A tall, fully loaded endcap can create strong impact, but it may block sightlines or feel difficult to shop. A lighter display with fewer SKUs can be more effective when the objective is fast decision-making. For narrow aisles, use fixture dimensions and signage that preserve clear customer flow and comply with store safety requirements.
Common Reasons Endcaps Underperform
Endcaps fail most often through weak execution rather than poor location. The assortment may contain too many unrelated SKUs, making the display read like overflow stock. The price message may be missing, too small, or inconsistent with shelf labels. Replenishment may be overlooked, leaving empty facings during the busiest trading hours.
Another issue is placing low-margin promotional products on an endcap without a clear basket-building strategy. Deep discounting can increase unit sales while reducing the financial value of the space. Retailers should assess gross profit and related-item sales, not only revenue.
Brand consistency matters as well. For chain stores, inconsistent sign placement, shelf heights, or display quantities make it difficult to compare results across locations. A documented planogram, approved fixture components, and a clear replenishment routine help maintain the intended presentation from store to store.
A Practical Test Plan for Your Next Endcap
Begin with one business objective: increase trial of a new product, clear seasonal inventory, raise a category’s unit velocity, or drive complementary purchases. Select no more than one primary objective for each display, because it determines assortment, price message, and the right performance measures.
Then establish a baseline using recent sales data. Choose a promotional period long enough to account for normal demand patterns, and confirm inventory before installation. Photograph the finished endcap so store teams have a reference for ongoing maintenance. Check it daily during launch, especially after peak traffic periods.
At the end of the test, compare promoted-item sales with the baseline and review category results. If the display increased sales but created repeated stockouts, the concept may be sound while the replenishment plan needs adjustment. If traffic was high but conversion remained low, revise the product mix, price message, or sign visibility before changing the location.
JS Retail Displays supports this kind of execution with commercial shelving, shelf merchandising components, POP signage, acrylic organizers, digital display options, and retail fixtures suited to different product categories. The goal is not to fill an aisle end. It is to give the promotion a reliable physical structure that staff can maintain and shoppers can understand quickly.
The most useful endcap is one your team can measure, replenish, and repeat. Start with a single shopping mission, build the fixture and message around it, then let the sales data show what deserves the next prime location.